Historical Average Price Report
Our Historical Average Price Report helps you analyse long-term property price trends going back decades. By understanding how property values have evolved, investors and buyers gain valuable context for market cycles, timing opportunities, and location-based growth performance.
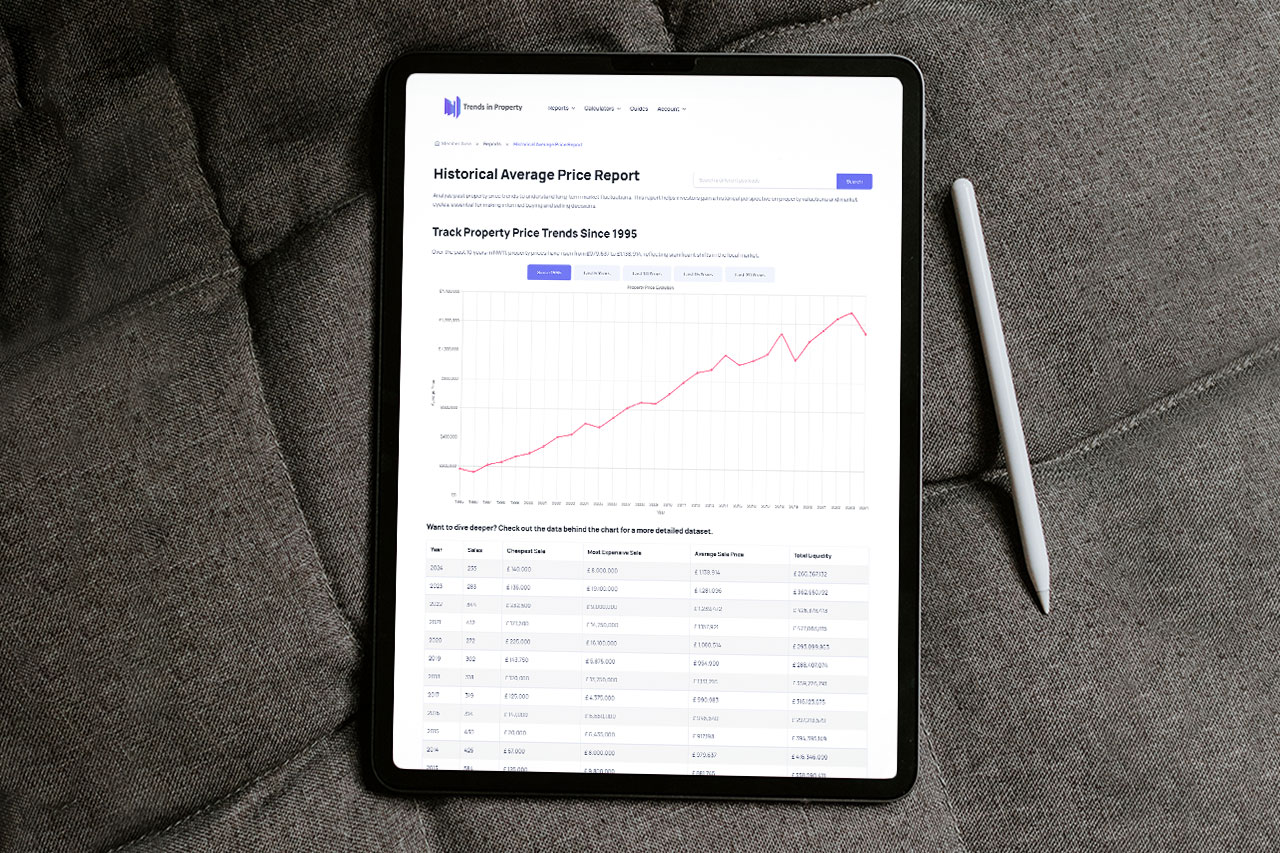
This report includes yearly average selling prices, along with the cheapest and most expensive sales, to provide a complete picture of property market dynamics over time.
Why This Report Matters
Understanding historical property price movements is crucial for anyone looking to invest strategically, evaluate long-term appreciation, or assess the timing of purchases or sales. This report allows you to:
- 📉 Track Market Cycles
Identify past peaks and troughs to better anticipate future trends. - 📊 Measure Growth Performance
See how specific postcodes have appreciated over 10, 15, or 20+ years. - 🔍 Compare Market Conditions
Assess how prices today compare to historical benchmarks for more informed decisions. - 📅 Analyse Price Trends Since 1995
Leverage a 30-year data window to evaluate long-term investment opportunities.
How It Works
Select a Postcode
Input your area of interest to reveal decades of price history.
Explore Historical Trends
View average price changes, volatility, and high/low points since 1995.
Gain Market Perspective
Use long-term data to assess timing, performance, and potential growth.
Get Full Access with Our Membership
As a member of Trends in Property, you’ll gain unlimited access to all our reports and tools
Join UsWhy Choose Trends in Property?
Our platform is designed for property investors, homebuyers, and industry professionals looking for reliable data-driven insights. Unlike generic property listings, we provide in-depth analysis and real-time market updates to give you a competitive edge.
Don’t rely on outdated or vague estimates – get precise, data-backed insights with our exclusive reports.
Become a member