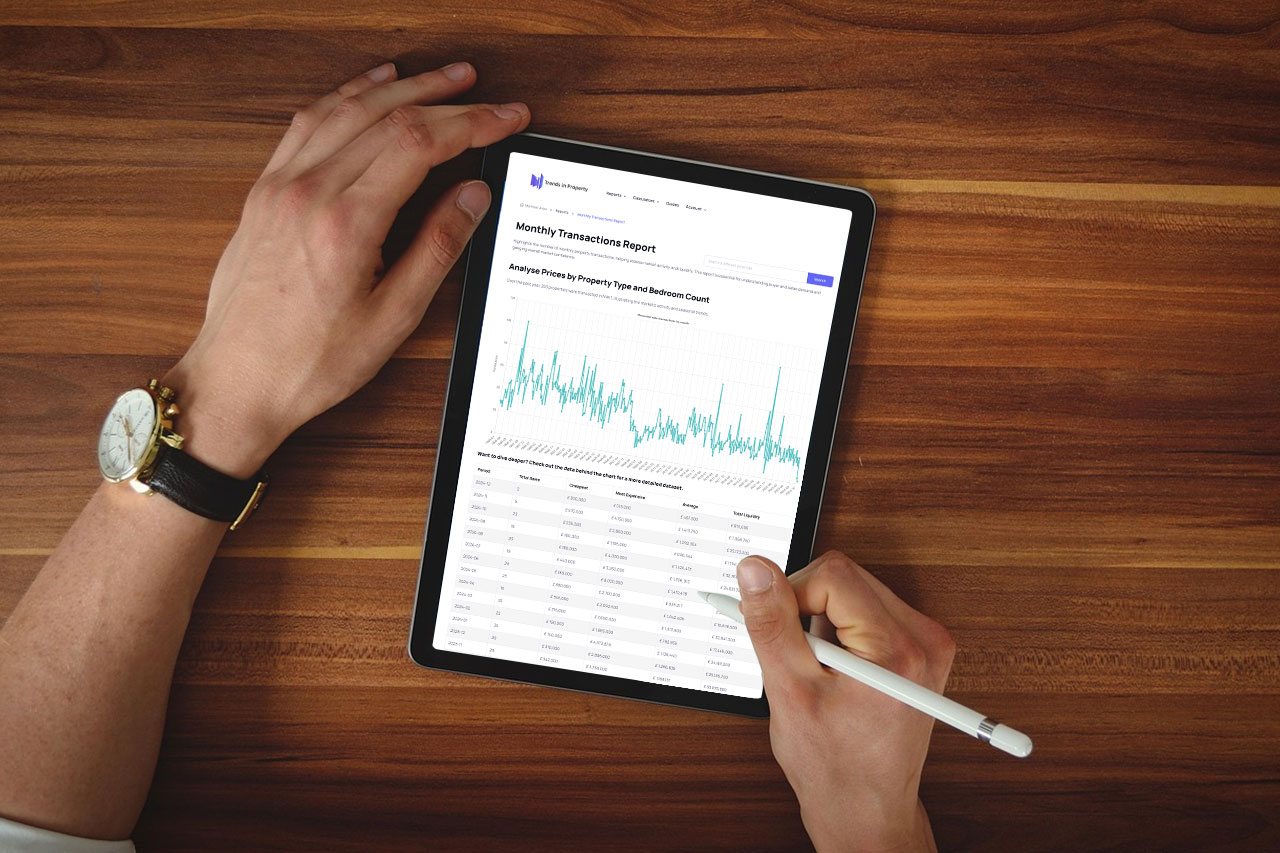
Monthly Transactions Report
The Monthly Transactions Report provides a detailed view of property sales activity over time, allowing you to monitor market liquidity, seasonality, and local demand patterns. By analysing monthly transaction volumes, investors and professionals can better time decisions and assess the stability of any given area.
This report includes historical transaction data segmented by property type and bedroom count, offering transparency into how often properties are changing hands in your selected area.
Why Use This Report?
Monthly sales activity reflects real-time supply and demand dynamics. Whether you're a buyer, seller, or landlord, understanding how active the local market is can shape your strategy. With this report, you can:
- 📊 Track Market Liquidity
See how many properties are being bought and sold monthly. - 📆 Identify Seasonal Trends
Spot predictable cycles in activity (e.g. summer surges or winter dips). - 🏘️ Understand Buyer Behaviour
Determine if demand is rising or cooling over time. - 📉 Assess Risk for Investments
Infrequent sales may indicate a less liquid or slower-moving market.
How It Works
Select a Location
Choose your target postcode to see monthly transaction activity across different property types.
View Historical Volume Trends
Track changes in transaction counts over the years, including peaks and troughs in activity.
Use Data to Time the Market
Align your decisions with active periods to improve speed and value of your transactions.
Get Full Access with Our Membership
As a member of Trends in Property, you’ll gain unlimited access to all our reports and tools
Join UsWhy Choose Trends in Property?
Our platform is designed for property investors, homebuyers, and industry professionals looking for reliable data-driven insights. Unlike generic property listings, we provide in-depth analysis and real-time market updates to give you a competitive edge.
Don’t rely on outdated or vague estimates – get precise, data-backed insights with our exclusive reports.
Become a member